Shrinking Core Expanding Edge in Busan and Gyeongnam
Busan and Gyeongnam operate as a single labor and logistics market anchored by Busan Port. Industrial land, incentive packages and infrastructure commitments, however, are administered separately.


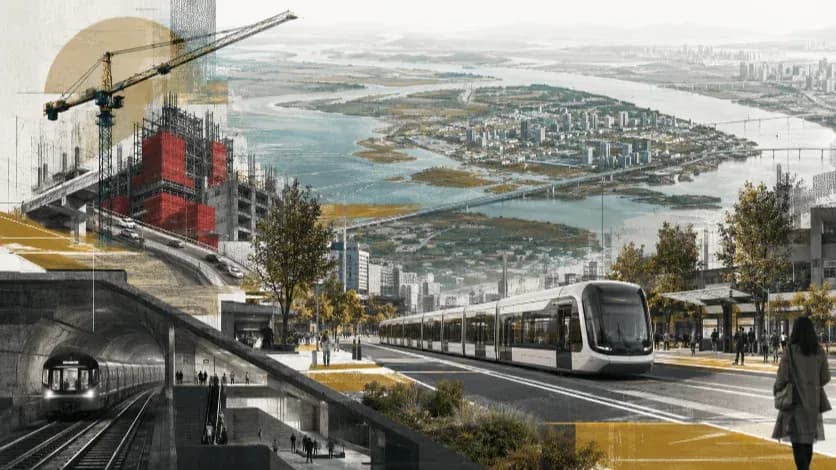
BUSAN — Busan’s population has fallen to roughly 3.3 million. Over the past decade, Jung-gu alone has lost more than 30 percent of its residents. Dong-gu and Seo-gu have followed a similar trajectory. Yet in the same period, most new apartment completions have been concentrated in western districts such as Gangseo and in parts of Gijang.
The city is contracting in people and expanding in space.
Municipal capital spending has increasingly flowed toward road extensions, residential infrastructure, and port-linked logistics corridors along the western edge. Meanwhile, sewer systems, public schools, and civic buildings in the historic core continue to be maintained for a population that no longer exists at previous scale. Enrollment declines do not eliminate heating costs. Vacant storefronts do not reduce utility obligations.
On a weekday evening in Jung-gu, commercial vacancy is visible block by block. A merged elementary school operates in a building designed for twice its current enrollment. A neighborhood bank branch closed last year. Thirty minutes away in Myeongji International New Town, recently completed apartment complexes report occupancy above 90 percent. New retail clusters stay open past 10 p.m. Parking lots are full.
The shift is not confined within city limits.
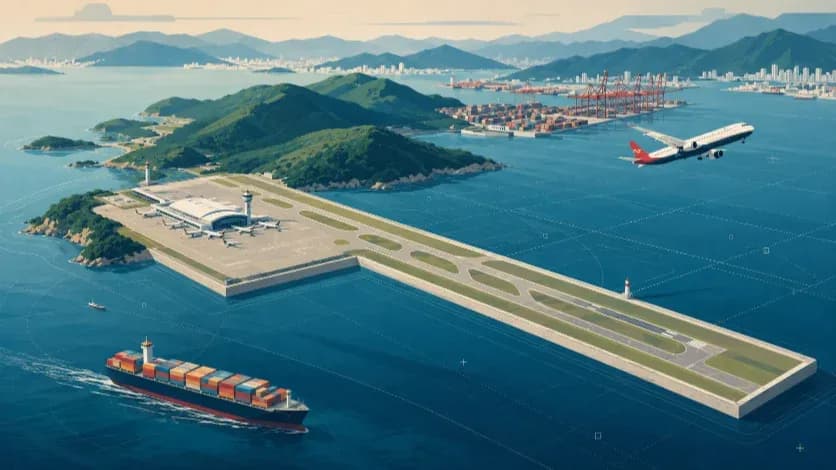
Every morning, workers commute from Gimhae, Yangsan, and Changwon into industrial and logistics sites connected to Busan Port. Containers unloaded at the port depend on manufacturing output across South Gyeongsang Province. The labor market and freight network function as a single system.
Administration does not.
Busan Metropolitan City and South Gyeongsang Province maintain independent investment promotion offices, negotiate incentive packages separately, and designate industrial land under distinct development plans. Dozens of investment memoranda have been announced on both sides over the past decade. Not all have resulted in operating facilities. Incentive commitments, however, are recorded at signing, and infrastructure obligations proceed regardless of absorption rates.
Industrial complexes across the broader Busan–Gyeongnam corridor target overlapping sectors in logistics, machinery, and light manufacturing. Some sites have filled steadily. Others have struggled to meet projections. Land preparation, road access, and utility extensions carry costs irrespective of occupancy.
What emerges is not a debate but a configuration: a metropolitan labor and logistics economy that spans administrative borders, a shrinking urban core requiring maintenance, and outward expansion financed in parallel.
The demographic contraction is measurable. The spatial expansion is visible. The administrative division is institutional. Together, they shape how public funds are committed, how industrial land is supplied, and how the region positions itself in a slowing national economy.
The Measured Donut
Busan’s population stood at roughly 3.57 million in 2013. A decade later it is closer to 3.3 million. The loss—about 270,000 residents—did not disperse evenly across the city. Jung-gu has shed more than 30 percent of its population. Dong-gu and Seo-gu each lost over one-fifth. In these districts the median age now exceeds 50, and classrooms built for hundreds of children hold a fraction of that number.
Housing growth moved west. Over the past several years, thousands of new apartment units were completed in Gangseo District and in parts of Gijang, particularly around Myeongji and the port corridor. Tower cranes marked the skyline there while inner neighborhoods added little beyond incremental redevelopment. Residential density in the historic center fell even as total built floor area in the western districts increased.
School mergers followed the population decline. Buildings designed for 700 students now operate at far lower enrollment levels. Heating systems run. Staff remain. Maintenance continues. Budget lines for these facilities did not contract at the pace of student numbers.
Roads and utilities extended in the opposite direction. New arterial links connect western housing clusters to Busan New Port. Sewer and water infrastructure followed those developments. Public transport routes were adjusted to serve new apartment complexes and logistics facilities. These projects moved through annual budget approvals while the city’s overall headcount continued to decline.
The older core retains its full infrastructure grid: sewer networks, road systems, public buildings, schools. None disappear when residents leave. They require upkeep regardless of occupancy. At the same time, new infrastructure in outer districts enters the city’s balance sheet. Land preparation costs, utility installation, and road construction add to long-term obligations.
Retail patterns reflect the same geography. In central districts, contiguous blocks show vacant storefronts. Small medical practices and neighborhood banks have closed in recent years. In the west, retail space tied to newly completed housing reports high occupancy. Parking lots fill in the evening.
The numbers describe a single movement: fewer residents in the center, more land developed at the edge. Population decline and spatial expansion have occurred during the same decade, recorded in the same budget documents.
Busan is carrying both.
One Production Region, Two Industrial Strategies
Each weekday, an estimated 60,000 to 80,000 workers cross between Busan and Gyeongnam. Commuters from Gimhae and Yangsan head toward logistics warehouses and distribution hubs near Busan New Port. Workers from Changwon travel toward port-linked industrial facilities. The movement is routine. It is built into the region’s labor market.
Busan New Port handles more than 20 million TEUs annually. A significant portion of outbound cargo originates from manufacturing facilities in Gyeongnam—machinery components from Changwon, automotive parts from Gimhae, industrial equipment from surrounding counties. Production and shipping operate within a single economic space.
Industrial promotion is organized differently.
Busan maintains its own investment promotion bureau under the metropolitan government. Gyeongnam operates a separate investment office under the provincial administration. Both attend overseas roadshows. Both negotiate tax abatements permitted under national law. Both provide land discounts inside designated industrial complexes. Local subsidies are reviewed through separate committees and approved under separate budget lines.
Between 2014 and 2023, both jurisdictions announced dozens of investment memoranda. Public disclosures list pledged investment amounts in the trillions of won combined. Completion data show uneven realization. Some projects advanced to full operation within two to three years. Others remain listed as “under preparation” or have not progressed beyond initial site acquisition. Pledged employment figures frequently exceed realized staffing levels in early operational phases.
Industrial land supply expanded in parallel. On the Busan side, logistics parks near the port corridor and in Gangseo District increased available warehouse and light industrial space. In Gyeongnam, additional manufacturing complexes in Changwon and Gimhae were designated or expanded. Several zones targeted similar sectors—logistics processing, light machinery, and component assembly—within a 30–40 kilometer radius.
Occupancy rates differ by complex. Core machinery clusters in Changwon report relatively stable tenant levels. Newer general industrial zones in outer zones show slower absorption. Land grading, road access construction, and utility installation were completed before tenants secured long-term leases in some sites. Debt tied to industrial land development continues to be serviced regardless of fill rates.
Incentive packages vary by jurisdiction. Land discount ratios differ. Local tax reductions are calculated independently. Direct subsidies are subject to separate review committees. There is no unified registry comparing incentive exposure across the metropolitan region.
For a firm evaluating southeastern Korea, the decision often centers on port access, labor availability, and supply chain proximity within a 50-kilometer radius. Administrative borders do not define that radius. Investment negotiations, however, are conducted on either side of it.
The result is measurable: parallel investment announcements, overlapping industrial land supply, and incentive commitments recorded independently in two fiscal systems serving one production base.
Land, Incentives, and Fiscal Exposure
Industrial land in the Busan–Gyeongnam corridor is not supplied as a single inventory. It is supplied as separate inventories, approved and financed separately. The distinction matters because site preparation costs are front-loaded. Roads are built first. Utilities are laid first. The debt, if any, starts accruing first. Tenants arrive later—sometimes much later.
On the Busan side, the western corridor has been shaped around port access. Gangseo’s logistics belt—warehouses, cold-chain facilities, distribution centers—expanded alongside new housing in Myeongji and adjacent areas. These sites require wide access roads, heavy-vehicle connections, and utility capacity designed for round-the-clock operations. Much of that spending sits in capital budgets and public corporations’ accounts, not in press releases.
On the Gyeongnam side, industrial land has continued to be added through manufacturing complexes in Changwon, Gimhae, and nearby counties. The portfolios are not identical—Changwon’s machinery base differs from port-adjacent logistics—but the overlap appears in the margins: general industrial zones targeting light manufacturing, parts assembly, packaging, and logistics processing. These are the zones most exposed when demand softens, because they compete on price, incentives, and proximity to the same transport nodes.
Absorption becomes the hinge variable. A complex that fills quickly converts sunk infrastructure into tax revenue and employment. A complex that fills slowly carries the same roads and utilities with fewer tenants contributing. Vacancy is not merely an empty lot. It is a balance sheet item: land acquired, graded, connected, and maintained.
Incentives amplify the exposure. Land discounts reduce upfront revenue from site sales or leases. Local tax abatements defer revenue that would otherwise offset infrastructure costs. Direct subsidies—training support, relocation aid, equipment grants—are booked as expenditures regardless of whether operations scale to projected employment. These commitments are made in separate fiscal systems, without a shared ceiling or a consolidated register that would show total exposure across the metropolitan market.
The fiscal load concentrates in three places.
First, site preparation and access infrastructure. Road widening, interchange works, drainage, and utility extensions are financed up front and amortized over years. Even when private developers build, public money often pays for access and trunk infrastructure.
Second, operating costs that do not fall when population or utilization falls. Older districts still require sewer maintenance, road resurfacing, and public building operations. School consolidation reduces staffing at the margin, but does not eliminate facility costs. These are not discretionary line items that can be cut quickly.
Third, the timing gap between commitments and returns. Incentive packages and infrastructure spending are committed early in a project cycle. Corporate investment is staged. Employment ramps later, if it ramps at all. When projects stall—at permitting, financing, or tenant acquisition—the public side continues carrying sunk costs.
This is where donut urbanization and industrial fragmentation meet. Housing spreads toward the west. Logistics land expands near the port. Industrial zones continue to be designated in multiple jurisdictions. The core city keeps its legacy infrastructure and loses payers. The edge adds infrastructure and waits for payers.
The exposure is recorded in ordinary documents—capital budgets, public corporation debt schedules, industrial zone occupancy reports, and local tax expenditure statements. It does not require a crisis to exist. It accumulates quietly, one approval cycle at a time.
Donut Urbanization and the Limits of Fragmented Governance
Busan has lost roughly 270,000 residents in a decade. The decline has been concentrated in its historic center. At the same time, new housing and logistics infrastructure have expanded westward, supported by successive capital budgets. The city now maintains aging infrastructure in districts that have fewer taxpayers while adding new infrastructure in districts that are still absorbing population and industry.
Across the administrative boundary, industrial land continues to be supplied under separate planning regimes. Incentive packages are negotiated independently. Memoranda of understanding are recorded separately. Industrial zones are financed and filled at different speeds. Yet the labor pool, freight flows, and supply chains function as one regional economy anchored by Busan Port.
Donut urbanization alters the geography of costs. The shrinking core carries fixed obligations. The expanding edge generates new commitments. When industrial strategy is fragmented across jurisdictions within that same metropolitan space, land supply and incentive exposure are determined by administrative lines rather than by consolidated demand.
The result is not immediate dysfunction. Containers move. Factories operate. Housing fills. The imbalance is slower and quieter. It appears in duplicated incentive exposure, parallel land inventories, and long-term infrastructure liabilities carried by separate fiscal systems serving a single economic base.
Administrative integration is often framed as a political question. In demographic and fiscal terms, it is also a spatial one. A metropolitan region that contracts in population while expanding in footprint cannot indefinitely treat industrial land, housing supply, and infrastructure as jurisdiction-specific decisions.
Busan and Gyeongnam already share a production region. What they do not share is a unified assessment of how much land to supply, how much incentive exposure to assume, and how to distribute infrastructure obligations across a shrinking demographic base.
The donut is visible in the city’s map. The fragmentation is visible in its budgets. Together, they define the operating condition of southeastern Korea’s largest non-capital metropolitan economy.
Editorial Context
"Independent journalism relies on radical transparency. View our full log of editorial notes, corrections, and project dispatches in the Newsroom Transparency Log."
Reader Pulse
The report's impact signal
Be the first to provide a reading pulse. These collective signals help our newsroom understand the impact of our reporting.
Join the discussion
A more thoughtful conversation, anchored to the story
Atlantic-style discussion for this article. One-level replies, editor prompts, and moderation-first participation are now powered directly by Prisma.
Discussion Status
Open
Please sign in to join the discussion.
The Weekly Breeze
Independent reporting and analysis on Busan,
Korea, and the broader regional economy.